Reporting
Reporting is critical for accountability to trappers, funders, councils etc. It's also really interesting. Find out more about the many easy reporting options here.
https://rappt.io/reports
- Project reporting
- Creating a static hex project map
- Camera trap recording and reporting including AI
- Understanding the bait-taken calculations
Project reporting
This is helpful for externally funded projects that are required to provide evidence of results achieved by the project.
The reports are broken into sections, Trap reports, Bait station reports, and Monitoring reports
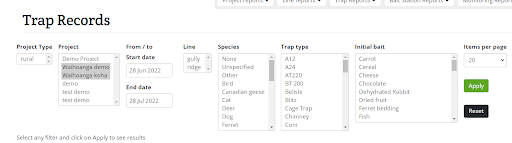
Links to these reports can be found under the reports heading on your project page and can be generated using a variety of filters to show the data wanted.
The most commonly used are:
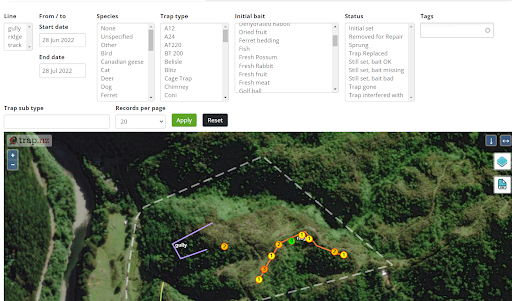
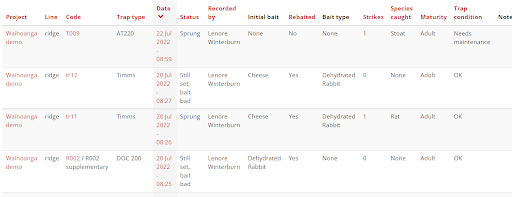
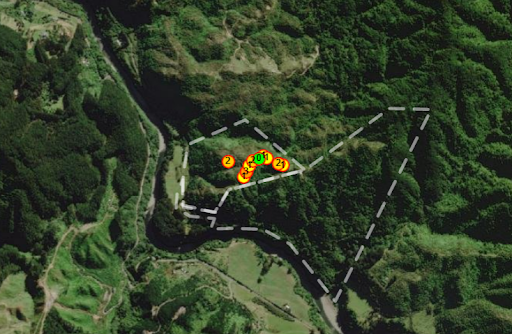
Trap records with map View/Download trap records. Optionally filter by date, species caught, etc
Heatmaps are available via the layer switcher (top right of the map)
Multi-project trap records Report traps across multiple projects
Or Multi-project trap records (with map) This shows a difference between projects in a visual way. Allowing the users to see what each project is achieving.
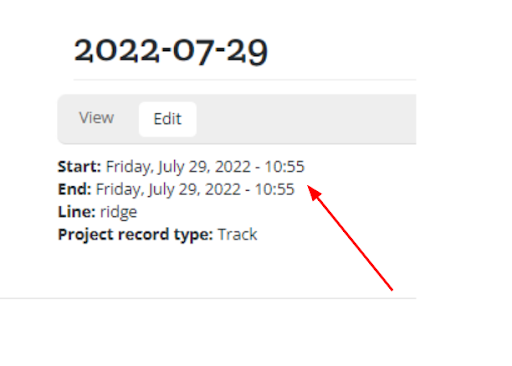
This shows the date the installations were last serviced. This helps ensure they do not fall outside of their default maintenance period.
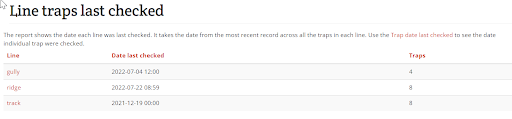
Trap date last checked with map

Multi-project Line date last checked
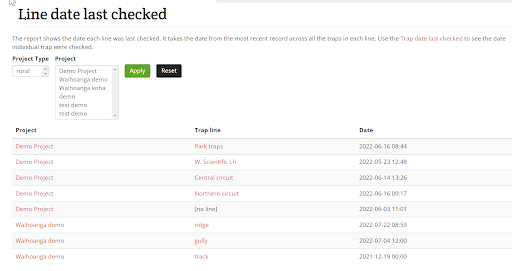
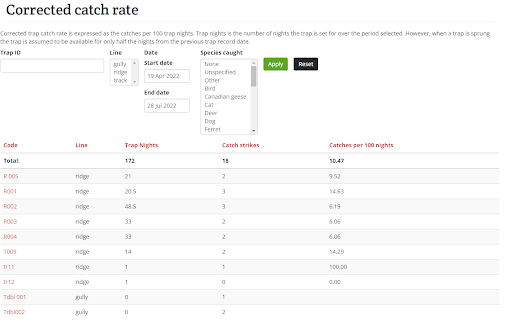
Corrected catch rate The corrected trap catch rate is expressed as the catches per 100 trap nights. Trap nights are the number of nights the trap is set for over the period selected. However, when a trap is sprung the trap is assumed to be available for only half the nights from the previous trap record date
Needing to know the amount of hours taken to service the project? Select tracks when in the App and record your tracks after which you access the projects page on the website, select Reports -Project reports
Select a displayed track the time spent checking the installations will show here
Trap Condition Shows traps across projects that have a condition set e.g. needs maintenance- now includes trap gone
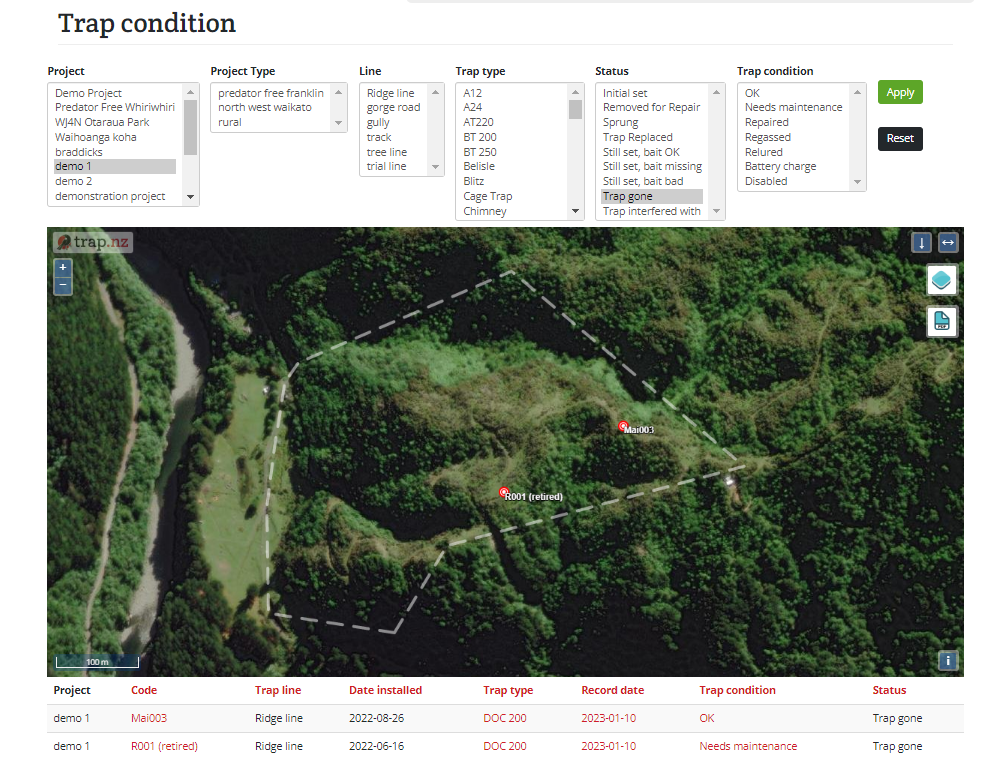
This can also be downloaded as a csv file
Creating a static hex project map
The static project hex map is useful for projects to show an audience your project/projects catches in an interactive way
The hex map is great for embedding into project websites (i.e. wordpress custom html) via an html embed tag:
<embed src="https://rappt.io/static/hexmap/?birds&projects=[] style="width: 100vw; height: 700px" />How do I get my own Hex Map?
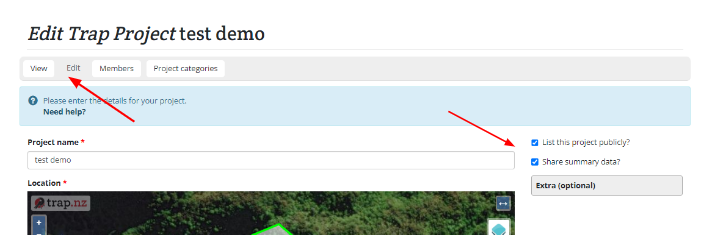
The hex map only displays publicly listed projects. ensure your project has the List this project publicly and Share summary data checkboxes ticked (you can find these information in the projects Edit page.)
Use the URL in the format below. Add your project ID number(s) to the brackets, if multiple projects, comma seperate the numbers.
eg: https://rappt.io/static/hexmap/?projects=[109200,380101,967870,420471,173214,183460]
And if you are wanting to display bird counts https://rappt.io/static/hexmap/?projects=[109200,380101,967870,420471,173214,183460]&birds
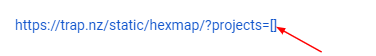
To find your project ID(s), navigate to the project home page where you will find the ID in the URL, eg: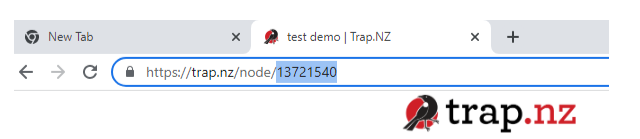
How do I see the results?
Copy and past the URL into a browser to test the results. It should looks something like this:
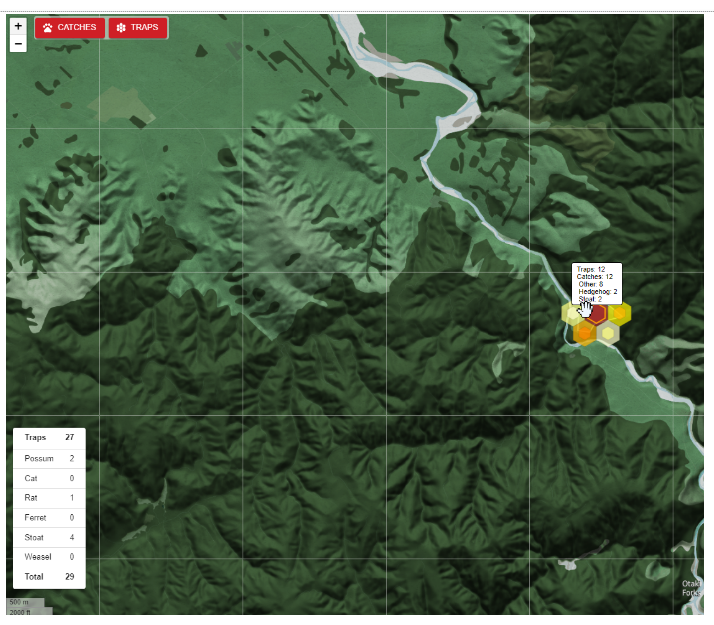
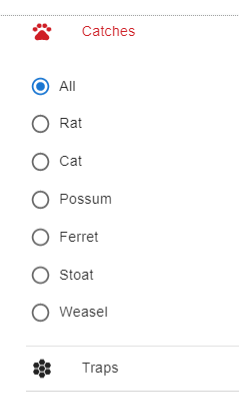
You can filter the catches and traps to reflect the catch you are wanting to display
Camera trap recording and reporting including AI
Projects using motion-triggered cameras (‘camera traps’) can use the Rappt.IO’s camera trap functions to load and tag images, optionally using image recognition software (AI, artificial intelligence) for assist in detecting species.
In order to load and tag images, you will need to create a monitoring station with a type “Camera” for each of your camera traps. A Camera station will have a button to allow the uploading of images.
The new AI identification option allows members to upload and tag captured images to your Rappt.IO project easily.
1. Select the camera on your Rappt.IO project you are wanting to add images to.
2. Open the installation and select upload images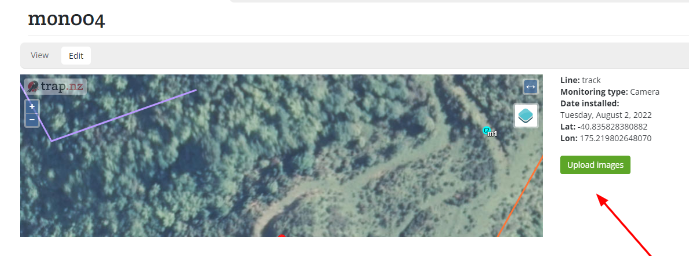
3. You will be prompted to drag and drop your files into the Rappt.IO page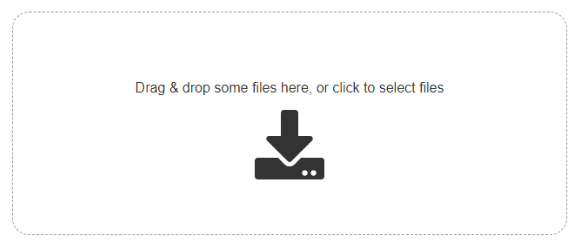
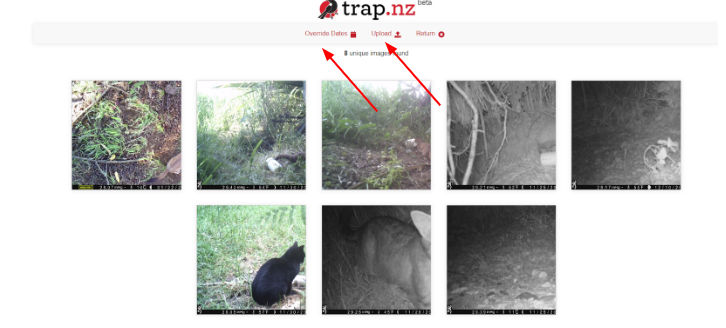
4. Your images will display ready for uploading. If the date/time shown is incorrect you can alter these settings here
Note: the programme will detect any duplicate images ensuring you don’t accidentally load them twice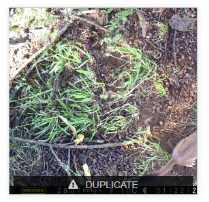
5. The images have all loaded successfully when the 100% appears in the bottom left corner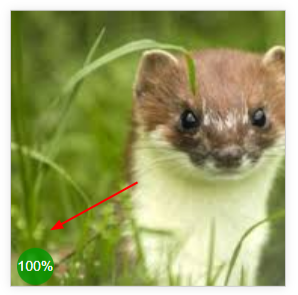
6. You can now choose to match with the AI and select return, be patient as this can take some time depending on the quantity being processed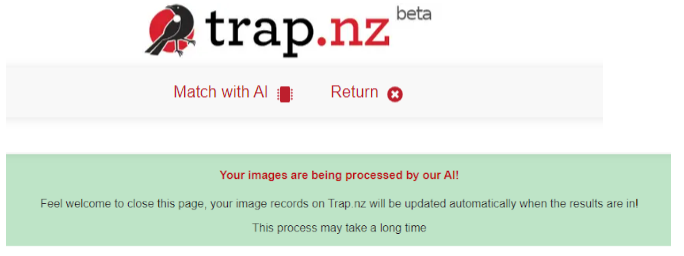
6. If you choose to match it with the Artificial intelligence software, the chip icon appears when it has matched.
You can exit the page while it is being processed without fear of loosing your records or having to start again.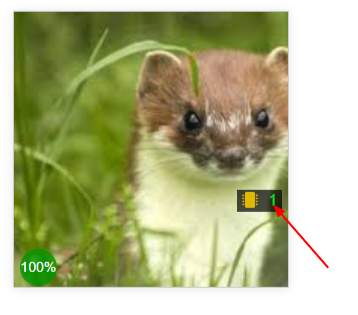
7. You will be redirected to the camera installation page, the records are displayed under the map, and you can now tag/ review species in the image set.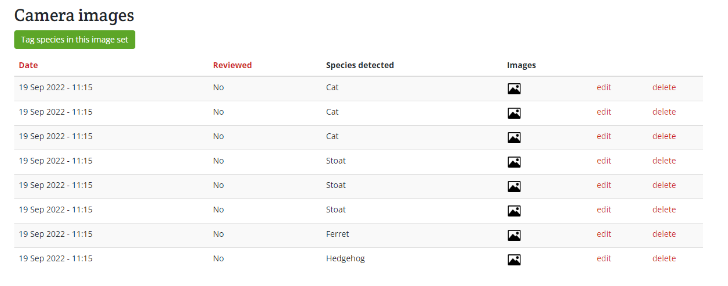
8. You can either use the mouse or the keyboard arrow keys to navigate the images. This allows you to easily edit the results
Sometimes the AI gets it right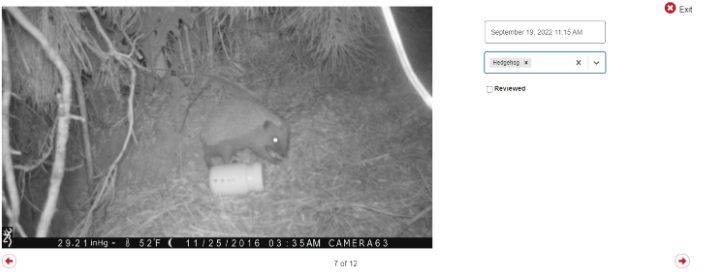
Sometimes the AI gets it wrong, you can edit the details by selecting the correct species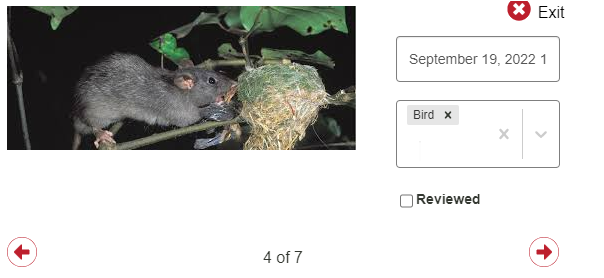
9. To run reports from the Camera images, select the monitoring tab, manage records, manage camera images, and select the filters you would like to use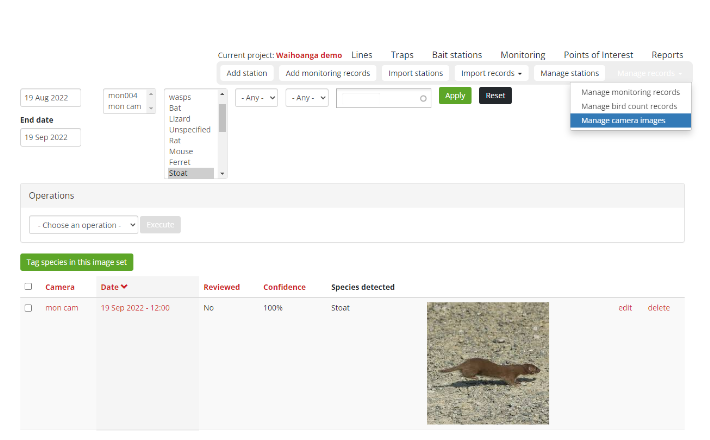
Reports can be exported using csv found at the bottom of the report page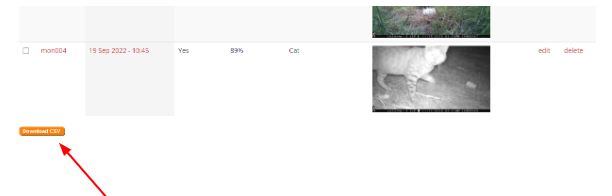
For video help click the you tube link here https://www.youtube.com/watch?v=anBWH_9UY_s
Understanding the bait-taken calculations
The bait-taken calculations can be a bit confusing to begin with, however, once you understand them it makes calculating the quantity of bait used within your project much easier.
When entering records in the field, the bait taken is automatically calculated by Rappt.IO based on the figures you have supplied.
There are some key points to know are :
* Bait taken is calculated from bait remaining on the current record minus the calculated bait remaining from the previous record with the additions and subtractions
* Records with the same date and time are invalid and will make calculations unreliable
* Bait-taken calculations are updated every few minutes, so may take some time to recalculate after changes are made
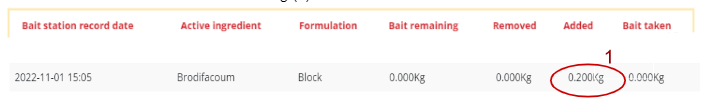
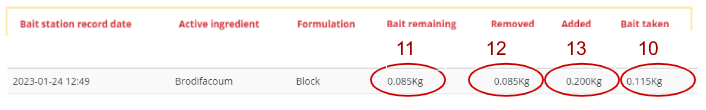
When working out the bait taken added you start at the bottom of the table and work up, In the case below
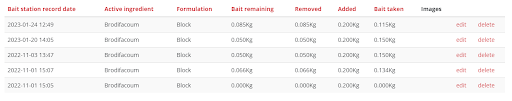
- On 01/11/22 the bait station had 0.200kg (1) added

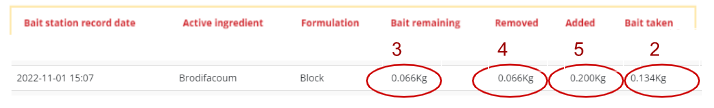
- On the next visit (working up the table) 0.134kg had been taken (2), leaving 0.066kg remaining (3). The remaining old bait (0.066kg) (4) was removed and fresh bait supplied 0.200kg (5) [0.200 - 0.134 =0.066] {0.066 - 0.066 = 0.000} [0.000 + 0.200 = 0.200]

-
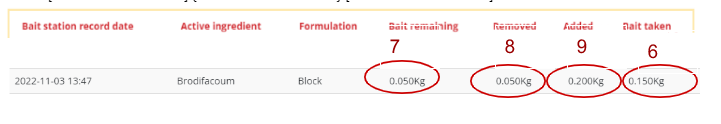
The following visit 0.150kg had been taken (6) leaving 0.050kg (7), the 0.050kg was removed (8) and another 0.200kg was added of fresh bait (9)
[0.200 - 0.150 = 0.50] {0.050 - 0.050 = 0.000} [0.000+ 0.200 = 0.200]

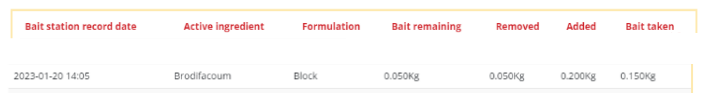
- On the next visit, 20/01/23 the same quantity was taken as the previous visit so the calculations are the same as above

- On the final visit showing 24/01/23, 0.115kg had been taken (10) leaving 0.085kg(11) remaining, the 0.085kg (12) was removed and 0.200kg (13) of fresh bait added [0.200 - 0.115 = 0.085] {0.085 - 0.085 = 0.000} [0.000+0.200=0.200]